
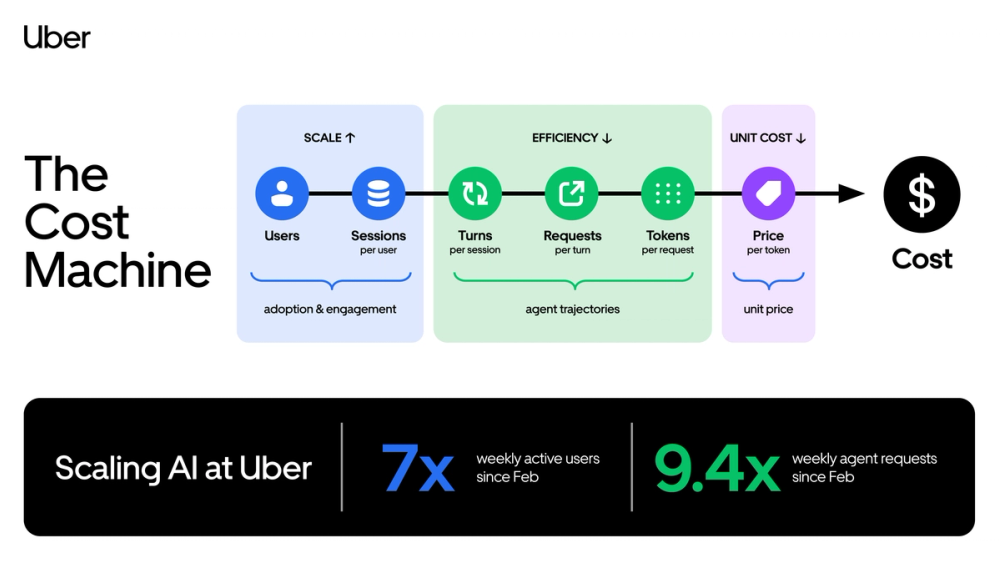
Source: Uber Engineering's software-factory report. This is Uber's original cost diagram, not a recreated chart.
Coding-agent pilots are easy to start and hard to budget. Uber says it expanded an internal AI software factory to thousands of reusable skills and tens of thousands of daily executions while stabilizing total AI spend. The useful story is not “free AI coding.” It is a cost-control system that measures the whole agent loop—and a set of internal results that still need careful boundaries.
Quick Navigation
- What is it? A shared platform for skills, context, models, and cost controls.
- What changed? Uber published scale and unit-cost trends from real internal use.
- How does it work? Six cost levers reveal where agent requests become expensive.
- Who should try it? Teams with task-level telemetry and repeatable workflows.
- Who should wait? Teams that cannot measure quality, retries, or failures.
- What remains unclear? Productivity, code quality, and independent reproduction.
What is Uber's AI software factory?
Uber's AI software factory is an internal platform that gives coding agents reusable skills, company context, model routing, and cost controls instead of leaving each developer with an isolated chat tool. In its August 27 engineering report, Uber says agents are attributed to about 70% of code pull requests, while more than 3,600 skills execute over 30,000 times per day. The company also reports roughly 7x user growth and 9.4x request growth while total AI spend stabilized after April. Those are meaningful operating signals, but they are self-reported internal measurements, not an independent productivity study. An independent explainx.ai analysis explains the cost controls and explicitly notes that the figures were not independently audited. The careful takeaway is that Uber has published a concrete agent-cost system; it has not proved that 70% of its code was autonomously written or that agent-attributed pull requests are better.
What We Know So Far
The report supports an infrastructure and unit-economics claim, not a blanket productivity claim.
- Confirmed publication: Uber released its engineering report on August 27 with original architecture and cost figures.
- Vendor-reported adoption: Uber says agents are attributed to about 70% of code pull requests and its skill library exceeds 3,600 entries.
- Vendor-reported scale: Uber reports 7x more users, 9.4x more requests, and total spend that stabilized after April.
- Independent context: explainx.ai and Port's Autonomous Engineering explain the architecture, but neither reproduced Uber's internal measurements.
- Evidence boundary: attribution does not mean an agent wrote the entire pull request, improved quality, or caused a productivity gain.
- Our judgment: the portable result is Uber's measurement framework, not its headline adoption percentage.
What changed in Uber's coding-agent economics?
Uber moved from tracking a growing AI bill to tracking the causes of each bill.
- How much did the model cost?: Uber's published control: Which tokens, route, latency, cache state, retry, or failure created the cost?; Why it matters: A cheaper model can still lose if it uses more tokens or fails more often
- How many people used agents?: Uber's published control: What happened to requests, sessions, and unit cost as adoption rose?; Why it matters: Total spend alone hides whether each useful task became cheaper
- Did an agent touch the pull request?: Uber's published control: Which reusable skill and context path supported the task?; Why it matters: Shared workflows can be measured and improved instead of copied as prompts
Uber's weekly chart shows users and requests rising steeply while total AI cost flattens. It is directionally useful, but it uses indexed lines rather than absolute user, request, or dollar values. That means readers can assess the trend, not reconstruct Uber's actual budget.
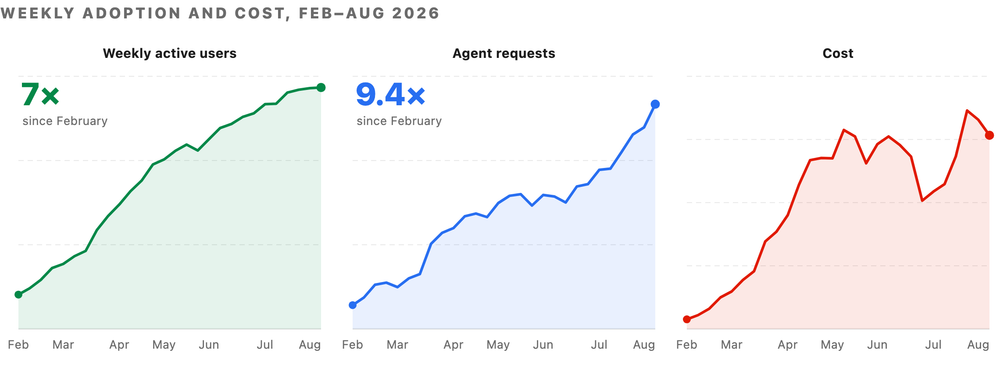
Source: Uber Engineering. Original indexed trend chart; absolute scale and independent reproduction are not available.
The most important change is the denominator. “Spend stayed flat” is not enough by itself: the team also tracked cost per request and cost per session. That separates real unit-cost improvement from a temporary budget cap or falling activity.
How does Uber control coding-agent cost?
Uber treats cost as a system with six connected levers rather than a single model price.
- Token volume: How much context and output each workflow consumes. 2. Model routing and token price: Which model handles each task and what its input and output cost. 3. Latency: How long the workflow holds resources and how quickly a developer gets a usable result. 4. Cache behavior: Whether shared context or repeated work can be reused instead of paid for again. 5. Retries: How often a failed or weak attempt triggers another model call. 6. Failures: How much spend produces no useful completion at all.
The formula matters because each lever can undermine another. Aggressive routing to a smaller model may lower token price but raise retries. Huge tool schemas can help an agent discover capabilities but inflate every request. More cached context can save tokens, yet stale context can produce a wrong change that costs more to repair.
Uber's architecture addresses that tension with reusable skills, model routing, shared company context, and telemetry around the agent workflow. Port's independent architecture analysis describes the broader platform approach, but it predates Uber's final cost report and should not be read as validation of the later percentages.
The developer view
Start with a task ledger, not a model leaderboard. For each workflow, record the selected model, input and output tokens, latency, cache hits, retries, failure reason, completion status, and human rework. Then compare the cost of a completed, accepted task—not only the price of one API call.
Reusable skills deserve the same versioning discipline as code. Pin their inputs, permissions, context sources, expected outputs, and evaluations. When a skill changes, compare task success and unit cost against the previous version. Otherwise a lower bill may hide worse output that developers quietly repair.
The product enthusiast view
Uber's report points toward coding agents that feel less like a clever chat window and more like a managed internal service. The interesting product shift is shared organizational memory and repeatable actions: developers choose a task, while the platform selects context, skills, and models behind it.
That does not make the agent autonomous or free. Someone still defines the skills, permissions, evaluations, and approved code path. The experience gets easier for the user because the operating complexity moves into the platform.
Did Uber really hold AI spending flat?
Uber says total AI spend stabilized after April while usage continued to rise. Its fixed-model chart provides a second view: cost per 1,000 requests finished 34% below its internal peak, and cost per session finished 52% below its peak.
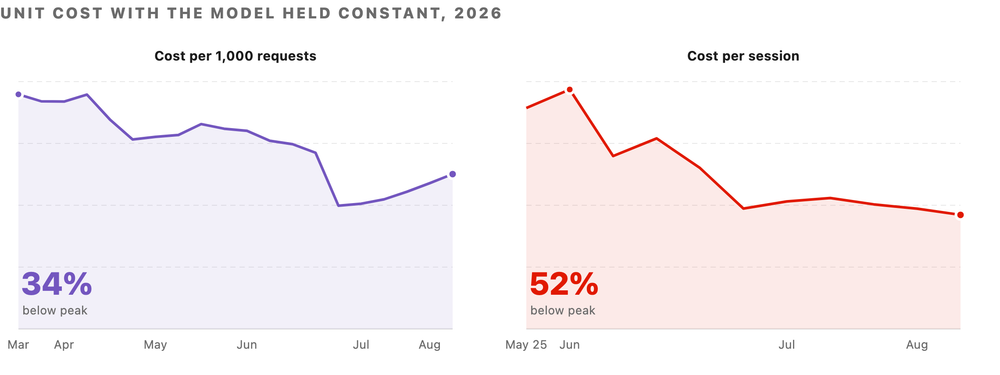
Source: Uber Engineering. Original fixed-model chart. The percentages compare with Uber's internal peaks, not a public baseline, and have not been independently reproduced.
Holding the model constant makes the chart more useful because a silent switch to a cheaper model cannot explain the entire change. But it still does not reveal the absolute dollar cost, task mix, quality-adjusted completion rate, or human review time. A cheaper session may be a better system—or a shorter session that pushes more work back to the developer.
The report therefore supports a narrow conclusion: Uber says it reduced internal agent unit costs as scale increased. It does not establish that another company will get the same curve, or that every agent-attributed pull request creates more business value.
Who should copy Uber's approach now?
Try the measurement pattern now if your team already runs repeated coding workflows and can connect model calls to an accepted task. Pick one high-volume workflow, such as test generation or dependency updates. Record quality, latency, tokens, cache hits, retries, failures, and human rework for two weeks before changing routing or context.
Wait before expanding access if you only have provider invoices and chat-level usage counts. Without task completion and quality data, optimization can reward shorter answers, fewer safety checks, or more developer cleanup. Build the ledger first, then tune the system.
The best pilot has one defined task, one acceptance test, one baseline workflow, and one owner who reviews failed runs. That produces a decision about cost per accepted result rather than a slide about the number of prompts sent.
What does Uber's report not prove?
- It does not prove that agents wrote 70% of Uber's code. Pull-request attribution can include partial agent assistance.
- It does not prove higher code quality. No public defect, rollback, security, or maintainability comparison accompanies the adoption number.
- It does not prove developer productivity. The report does not publish a controlled comparison of time saved or output per engineer.
- It does not publish absolute spend. Indexed trends show direction but prevent outside cost reconstruction.
- It does not provide independent reproduction. The independent analyses explain Uber's approach but do not audit the internal data.
- It does not guarantee transfer. Team size, repository shape, review policy, model access, and task mix can change the economics.
Quick Take
- What is actually new?: Evidence-backed answer: Uber published a concrete six-lever cost model plus internal scale and unit-cost trends
- What is the strongest evidence?: Evidence-backed answer: Original Uber charts showing indexed usage, total-cost, and fixed-model unit-cost movement
- Who should try it now?: Evidence-backed answer: Teams that can measure cost per accepted task, quality, retries, failures, and human rework
- Who should wait?: Evidence-backed answer: Teams with only invoices, prompt counts, or agent-attribution labels
- What is still unknown?: Evidence-backed answer: Absolute spend, independent reproduction, quality change, and causal productivity impact
Bottom line: Uber's most useful contribution is not a 70% adoption headline. It is a practical way to turn coding-agent cost into observable levers. Copy the measurement discipline first; treat the internal outcomes as a case study, not a guarantee.
FAQ
What is the Uber AI software factory?
It is Uber's internal platform for giving coding agents reusable skills, company context, model routing, and cost controls. Uber says the platform has more than 3,600 skills with over 30,000 daily executions. It is an internal engineering system, not a public coding-agent product.
Did AI agents write 70% of Uber's code?
That is not what the evidence proves. Uber says agents are attributed to about 70% of code pull requests. Attribution may include partial assistance, and the report does not publish what share of each change was agent-written or compare the resulting code quality.
How did Uber keep coding-agent costs from rising with usage?
Uber reports controlling token volume, model routing and price, latency, caching, retries, and failures as one system. It also measured cost per request and per session. The company did not publish enough absolute data for outsiders to reproduce its total budget.
What should developers measure before scaling coding agents?
Measure cost per accepted task, input and output tokens, model route, latency, cache hits, retries, failure reasons, evaluation results, and human rework. Provider price alone can look favorable while weak outputs or repeated attempts make the completed task more expensive.
What remains unverified about Uber's results?
Uber's internal scale and cost figures have not been independently reproduced. Public evidence also does not establish a causal improvement in productivity, code quality, security, or maintainability. The unit-cost percentages are relative to Uber's own peaks rather than a public comparison baseline.
Discover practical AI products and emerging developer tools at AIToolHunt.